


Key Takeaways
- The QT interval reflects how long the heart’s ventricles take to contract and recover. Accurate QT measurement is essential for assessing cardiac health, especially when evaluating arrhythmia risk and medication safety.
- Corrected QT (QTc) formulas adjust for heart rate. Bazett’s formula is the most widely used, though alternatives like Fridericia’s offer more accuracy at extreme heart rates.
- Measuring QT accurately requires identifying both the Q wave onset and the T wave end. This can be tricky, especially with noisy ECGs, U waves, or single-lead devices like Apple Watch and Fitbit.
User Profile
Calculating the QT interval accurately is vital for evaluating cardiac health. This measure reflects the time needed for the ventricles to depolarize and repolarize, indicating the duration of ventricular systole. Grasping this concept is crucial for ECG interpretation and clinical decision-making.
This straightforward measure offers insights into the heart's electrical function. It is integral in both monitoring drug safety and cardiac risk evaluation.
What Does the QT Interval Indicate?
The QT interval provides a view into the heart's electrical activity, combining ventricular depolarization (indicated by the QRS complex) and repolarization (indicated by the T wave). It spans from the beginning of ventricular contraction to the end of relaxation.

Precision in measurement is vital, as both excessively long and short QT intervals can signal potential cardiac issues.
The Progression of QT Interval Measurement
Tracing the QT interval’s journey through time reveals just how central it has become to modern cardiology. Back in 1895, Willem Einthoven first identified the P, QRS, and T waves that form the foundation of ECG interpretation. However, attention to the QT interval came later. By the 1920s, Dr. Henry Bazett introduced a now-classic formula (QTcB = QT/√RR) to correct the QT interval for heart rate, a breakthrough that shaped decades of clinical practice.
Over time, researchers uncovered limitations in Bazett’s method, especially at extreme heart rates, prompting the development of alternative corrections like Fridericia’s and Framingham’s. Still, Bazett’s formula remains favored. From a once-overlooked measurement, the QT interval has evolved into a vital marker for assessing cardiac safety and risk—reflecting both scientific progress and clinical necessity.
RR Interval: The RR interval is the time elapsed between two successive R-wave peaks of the QRS signal on the electrocardiogram, representing one cardiac cycle. It is used to calculate heart rate.

Normal QT Interval Ranges and Prolongation
QT intervals are influenced by factors including age, sex, and heart rate. In adults, a normal corrected QT interval (QTc) is typically under 440 milliseconds in men and under 460 milliseconds in women. Prolongation of the QTc, particularly beyond 500 milliseconds, is worrisome.
Extended QTc intervals increase the likelihood of serious arrhythmias, such as Torsades de Pointes. Assessing when prolongation becomes a significant risk necessitates a detailed evaluation tailored to the individual patient.
Mastering Raw QT Measurement: A Practical Guide
Measuring the QT interval on an ECG can be complex. This section outlines the steps involved, from identifying the Q wave onset to determining the T wave offset, and discusses common challenges and differences between manual and digital methods. Mastering these skills is essential for reliable clinical assessment before applying correction formulas.

Identifying the Q Wave Onset
The Q wave is the initial downward deflection after the P wave, marking the start of ventricular depolarization. Identifying its onset can be challenging, especially with noisy ECGs or small Q waves. Aim to find the first point of clear downward movement from the baseline.
Determining the T Wave End
The T wave shows the heart's recovery phase, but it's often tricky to figure out. T wave shapes can look different, making it hard to tell where the T wave ends and a U wave or baseline drift begins. This requires a close look. One way to find the end is by drawing a line along the steepest part of the T wave slope and seeing where it hits the baseline. This point is usually the T wave end.
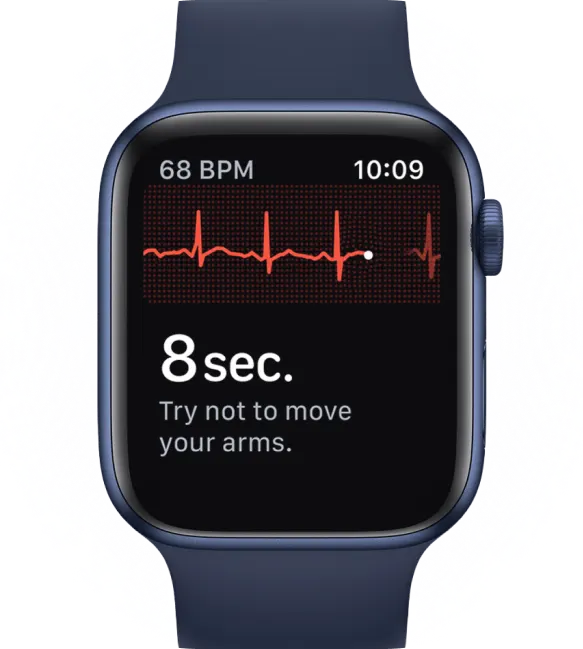
When using 1-lead devices like Apple Watch or Fitbit, it can be even more challenging to measure the T wave accurately due to their limited data capture.


Addressing Common Measurement Challenges
Several factors can complicate QT measurement. Baseline drift makes establishing a stable baseline difficult. U waves, small upward deflections after the T wave, can be mistaken as part of the T wave. T wave morphology variations, such as notched or biphasic T waves, require careful use of the tangent method.
Manual vs. Digital Measurement Techniques
Traditionally, QT intervals were measured manually using calipers on printed ECGs. Though still practiced, this method is susceptible to inter-observer variability. Digital calipers in ECG software offer greater precision and reduce variability. Automated algorithms in some ECG systems further facilitate measurements. However, validating automated readings is crucial, especially in complex cases.
The following table illustrates the differences between these methods:
Each method has its strengths and weaknesses, making it important to choose the right tool for the task. While manual calipers offer simplicity, digital calipers and automated algorithms provide increased accuracy and efficiency. However, user interpretation and validation remain essential for reliable results.
Practical Tips for Consistent Measurement
For consistent QT measurements using 1-lead devices like the Apple Watch, consider the following tips:
- Measure several consecutive beats and select the longest QT interval.
- Ensure accurate baseline identification and adjust for drift if necessary.
- Consistently apply the tangent method for determining T wave offset.
- Include large, fused U waves in the QT interval, but exclude smaller, distinct ones.
- Verify automated measurements, especially in complex ECGs.
By mastering these techniques, you can achieve more accurate QT interval calculations, essential for effective cardiac assessment and management. Accurate raw QT measurement is crucial before using services like Qaly, which provide advanced automated ECG analysis, including precise QT interval readings and expert reports. Integrating your skills with automated analysis tools can offer additional insights into cardiac health.
Have trouble measuring your QTc Interval? On the Qaly app, human experts will measure your ECGs' QTc Interval within minutes. Get started today.


.png)
.png)