


Key Takeaways

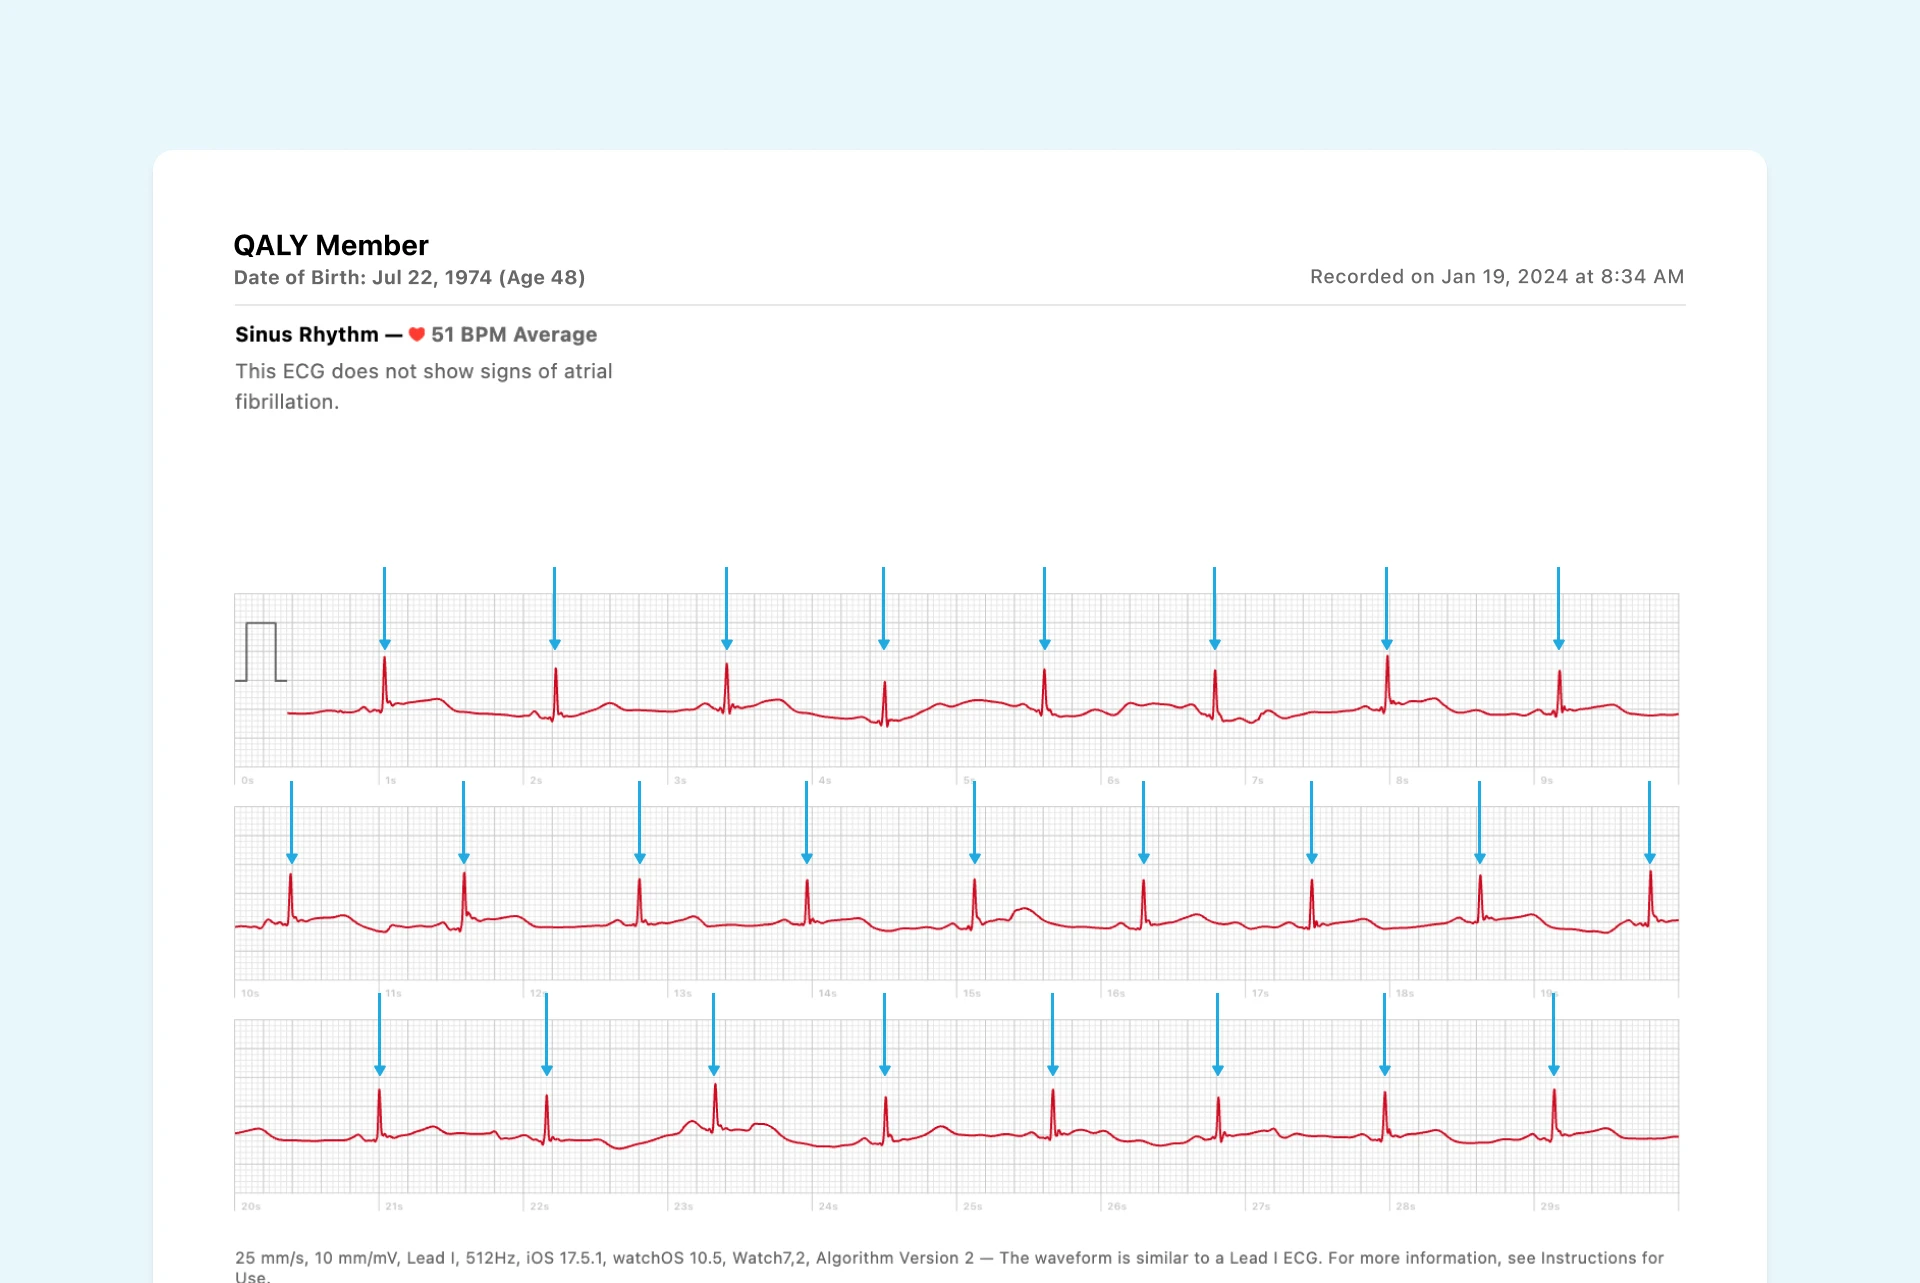
User Profile
Hello Heart Hero. Figuring out your heart rate from an ECG is the most direct way to listen to your heart. It’s a true measure of the electrical signals that make your heart beat. This is different from app-based sensors that just estimate your pulse using light. An ECG gives you a precise, beat-by-beat electrical tracing, a much clearer window into what your heart is actually doing.
Welcome to Your ECG Journey

Looking at an ECG strip for the first time can feel like you’re trying to read a secret code. With all the complicated medical terms out there, it’s completely normal to feel a bit overwhelmed, especially when you're figuring this out on your own. Many people feel skeptical or let down by the healthcare system, and it makes sense to look for your own answers.
But this guide is different. We built it to be a clear, reassuring resource to empower you. Our goal is to simply walk you through understanding one of the most fundamental signals your heart sends you: its rate.
Think of this as your personal decoder ring for your heart's rhythm. We'll start with the basics of what an ECG actually shows and why it’s such a powerful tool for your health.
What We Will Cover Together
We’ll go step-by-step, making sure every idea is clear before we move on to the next one. Here’s what you’ll learn:
- How to read the basic parts of an ECG strip. We'll break down what those squiggly lines really mean in a simple, straightforward way.
- Two easy methods to calculate your heart rate. You’ll pick up practical skills to turn those lines into a number that makes sense.
- What your heart rate number truly means. We’ll go over what’s considered normal, fast, or slow, without causing any unnecessary alarm.
- How to get the best readings from at-home devices. We’ll share tips for using your smartwatch or other personal ECG monitors so you can trust the data you see.
By the end of this guide, those confusing lines on your ECG will start to click. Our aim is to give you the knowledge and confidence to take a more active role in your heart health, turning that feeling of uncertainty into empowerment.
Decoding the Squiggly Lines on Your ECG
Before we can find your heart rate from an ECG, we need to get comfortable with what those squiggly lines actually mean. It's less complicated than you might think. Imagine your heart is a tiny electrical generator. Every single time it beats, it sends out a small electrical pulse that ripples through the heart muscle, telling it to contract and pump blood.
An electrocardiogram, or ECG, is just a visual map of these electrical pulses over a stretch of time. Think of it like a seismograph for your heart. It captures the rhythm and strength of its electrical activity, giving us a much clearer window into your heart’s performance than just feeling for a pulse.
The Story Each Heartbeat Tells
Every part of that wavy line on your ECG tells a specific part of your heart's story for a single beat. This pattern repeats over and over again, creating a consistent cycle. You'll see a few main shapes: a small bump to start (the P wave), a big, sharp spike (the QRS complex), and a final, rounded hill (the T wave).
For our purposes right now, that tall, sharp spike is our most important landmark. The very tip-top of this spike is called the R wave. It’s the easiest part to spot on any ECG strip because it's usually the most prominent feature.
Finding Your Heart's Tempo
If your heart is a drummer, each R wave is the sound of it hitting the drum. The time between each of those drumbeats tells you the song's tempo. It works the exact same way with your heart. The time between two R waves in a row, what we call the R-R interval, tells us the precise time between two heartbeats.
By measuring this R-R interval, we can accurately calculate your heart's tempo, or its rate in beats per minute. This interval is the key piece of information we'll use in the next sections to turn the ECG tracing into a simple, understandable number.
So, how do we measure that time? We use the special grid paper the ECG is printed on. This paper is marked with small and large squares, and each square represents a fixed amount of time.
- One small square is 0.04 seconds.
- One large square, which is made of five small squares, is 0.20 seconds.
Getting a feel for this timing is the key that unlocks everything else. Once you can confidently spot the R wave and count the squares between beats, calculating your heart rate becomes a surprisingly simple task. This basic knowledge lets you start reading the story your heart is telling, one beat at a time.
Two Simple Methods to Calculate Your Heart Rate
Ready to turn those squiggly lines into a real number? It’s a lot simpler than it looks. We’re going to walk through two of the most common and reliable methods for figuring out your heart rate from an ECG strip. It might feel a bit like math class at first, but stick with it, you'll get the hang of it in no time.
These methods work because standard electrocardiograph machines are all set up the same way. They run at a paper speed of 25mm per second, which creates a universal grid for us to work with. At this speed, one minute of an ECG strip contains 1500 tiny squares or 300 large squares, giving us the magic numbers for our calculations.
This diagram shows the basic parts of a single heartbeat on an ECG.
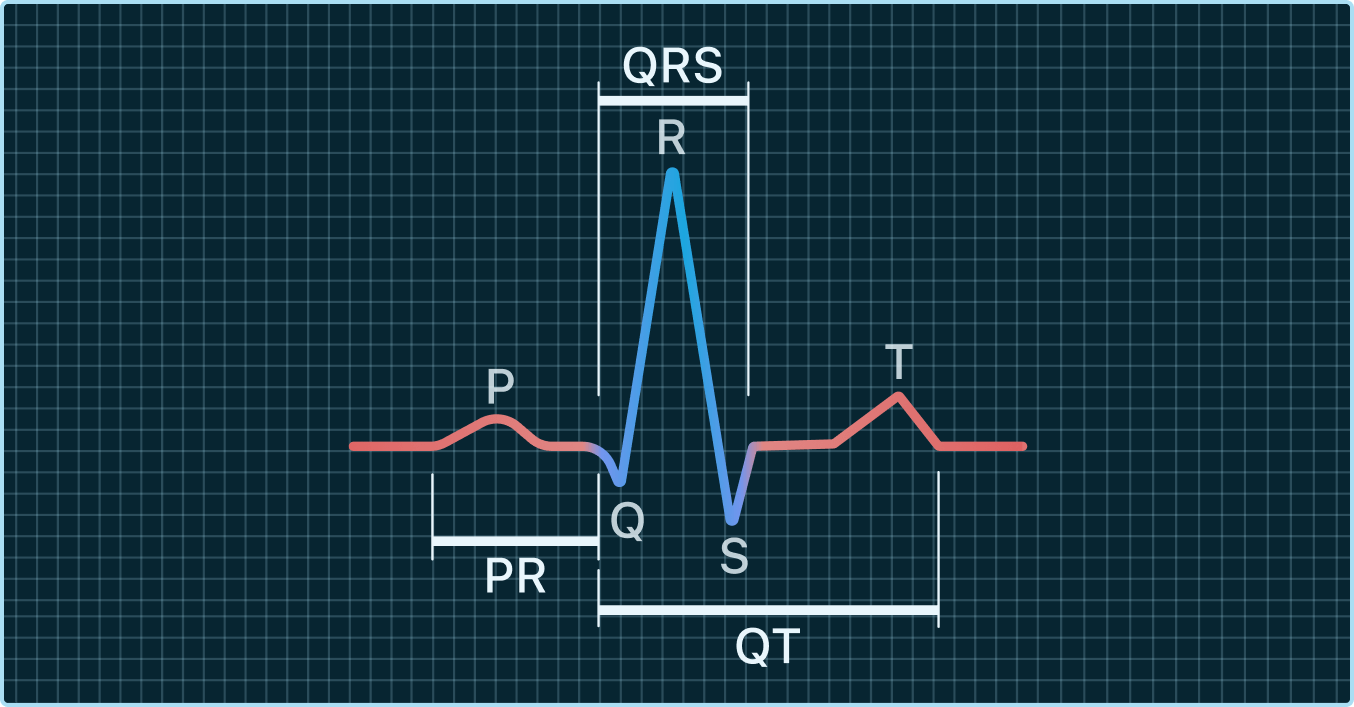
Spotting that tall spike, the R wave within the QRS complex, is the starting point for both methods we're about to cover.
The 1500 Method for Precision
This first technique, often called the 1500 Method, is fantastic when you need a very precise heart rate, especially if the rhythm is fast. The only catch is it requires a bit of careful counting.
Here’s how you do it:
- Find two R waves in a row on your ECG strip.
- Count the number of tiny squares on the grid paper between the peaks of those two R waves.
- Divide 1500 by that number. The result is your heart rate in beats per minute (BPM).
For example, let's say you count 20 small squares between two R waves. The math would be 1500 ÷ 30 = 50 BPM. Simple as that. If you counted 15 small squares, it would be 1500 ÷ 15 = 100 BPM. This method gets you a really accurate rate.

Key Takeaway: The 1500 Method offers high precision but works best for regular heart rhythms. For rhythms that are very slow or irregular, our next method might be a better fit.


The 300 Method for a Quick Estimate
Next up is the 300 Method, sometimes called the large square method. This one is perfect for getting a quick, rough estimate of your heart rate without having to count dozens of tiny boxes. It's a great skill for a fast check-in.
The steps are very similar:
- Find two R waves in a row.
- Count the number of large squares between the peaks of those two R waves.
- Divide 300 by that number to get your heart rate.
Let's try an example. Imagine you see 6 large squares between two R waves. The calculation is 300 ÷ 6 = 50 BPM. If there were only 3 large squares, your heart rate would be 300 ÷ 3 = 100 BPM. It's fast, easy to do in your head, and gives you a great ballpark number.
While these methods help determine heart rate, other important metrics exist. To go a step further, check out our guide on how to calculate HRV from an ECG.

What Your Heart Rate Number Actually Means
So, you’ve turned those squiggly lines from your ECG into a number. That’s a huge step forward. Now, let’s talk about what that number is actually telling you, because without context, a number is just a number. It's easy to see a heart rate and feel a rush of anxiety, but your heart rate is a dynamic signal, not some fixed judgment on your health.
The first thing to know is there’s no single “perfect” heart rate. What’s normal for you is a moving target, depending on your age, how fit you are, and what you’re doing in that moment. A fast heart rate after a workout or a stressful meeting? That's completely expected. What we’re often more interested in is your resting heart rate, the tempo your heart keeps when you're calm and relaxed.
One large analysis of over 46,000 people with low cardiovascular risk found that 96% of them had resting heart rates between 48 and 98 beats per minute. This gives us a really helpful baseline for what a typical healthy range looks like.
Understanding the Different Ranges
To make sense of your number, clinicians use a few general categories. It helps to think of these not as scary diagnoses but as simple descriptions of your heart's speed.
- Normal Sinus Rhythm (60-100 BPM): For most adults at rest, a heart rate in this sweet spot is considered normal. It means your heart's electrical system is firing at a steady, appropriate pace.
- Tachycardia (Over 100 BPM): This is just the medical term for a heart rate that's faster than normal while you're at rest. Remember, things like exercise, caffeine, or stress can all cause temporary tachycardia, and that's perfectly fine.
- Bradycardia (Below 60 BPM): This simply means you have a slower-than-normal resting heart rate. For very active people and athletes, a heart rate in the 40s or 50s can actually be a sign of excellent cardiovascular fitness.
The key isn't a single reading but the overall pattern. A consistently high resting rate, or a slow rate that comes with dizziness or fatigue, is a pattern worth exploring.
For instance, seeing your heart rate jump to 120 BPM while you’re rushing to an appointment is just your body's normal response. But if you’re consistently seeing a resting rate of 110 BPM while you're just watching TV, that's a different story.
This is the kind of pattern that’s useful to notice and maybe discuss with a professional you trust. Understanding your personal baseline helps you spot what’s different for you, not just what’s technically high or low. For a deeper dive into this, you might be interested in our article on what makes up a normal cardiac rate.
Using Your At-Home ECG Smartwatch and Wearables

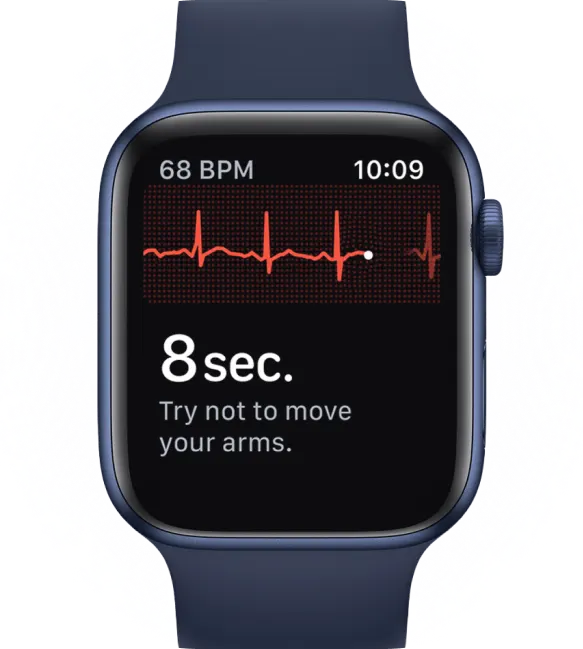
It’s pretty incredible that technology has put powerful health tools right on our wrists. Today, getting an ECG doesn't always mean a trip to the doctor's office. Many of us use smartwatches to keep an eye on our hearts, which is a huge step forward in personal health awareness.
But it’s a fair question to ask: how reliable are they, really? Let's have an honest look at the single-lead ECGs from devices like a KardiaMobile or your smartwatch. Their biggest strengths are convenience and the ability to spot trends over time, giving you a valuable log of what your heart is doing day-to-day.
These devices do have their limits, though. The most common hiccup you'll run into is what's called "artifacts" or electrical "noise." This is when a reading looks messy, jumbled, or just plain unreadable, and it happens to everyone.
Getting a Clearer Reading
A messy ECG can be frustrating, but the fix is usually simple. Artifacts are often just caused by tiny movements or poor contact with your skin. Think of it like trying to tune in to a faint radio signal, any bit of interference can scramble the message.
Here are a few practical tips to get the best possible heart rate from your ECG reading:
- Stay perfectly still. Find a comfy spot to sit and rest your arm on a table or your lap. Try not to talk or move around while the reading is in progress.
- Ensure good contact. Make sure your watch is snug against your wrist. If your skin is very dry, rubbing on a small amount of lotion beforehand can make a huge difference in the connection.
- Relax and breathe. When you tense your muscles, you can create electrical noise that messes with the reading. Take a few calm breaths before you start.
These simple adjustments can be the difference between a noisy, useless strip and a crystal-clear one. Taking a moment to get set up helps ensure the data you’re collecting is as accurate as it can be.
Research is backing up the growing reliability of these tools, too. The Health eHeart Study analyzed over 3.1 million heart rate measurements and found that smartphone-based monitoring was highly reliable when compared to standard clinical ECGs. This should give you confidence that your device, when used correctly, is a valuable part of your health toolkit.
When to Share Your ECG With a Professional
This guide is designed to give you more knowledge and confidence, but it's crucial to know when a professional eye is needed. Figuring out your heart rate from an ECG is a great first step, but a full interpretation takes years of training.
Think of your at-home device as a fantastic early warning system, not a final diagnostic tool. Knowing when to take that next step and talk to a pro is a huge part of being your own best health advocate.
Signs It's Time for a Conversation
You don't need to stress over every little fluctuation. What you're looking for are consistent trends or any physical feelings that show up with your readings. It's a good idea to share your ECG with a professional if you notice:
- A resting heart rate that is consistently above 100 BPM (tachycardia) or consistently below 50 BPM (bradycardia), especially if this is a new change for you.
- An ECG that shows an irregular rhythm, even when your heart rate number seems normal.
- Any reading, no matter the rate, that happens at the same time as symptoms like dizziness, shortness of breath, chest pain, or fainting.
Your experience is just as important as the data on the screen. If a reading comes with a physical symptom, it’s always worth discussing with a professional.
When you do share your ECG, healthcare professionals often use specialized medical documentation software to record their findings and keep a clear history of your heart's activity. For those looking for clarity sooner, expert ECG analysis services offer a valuable middle ground. They can give you a professional review of your smartwatch ECGs, which helps provide peace of mind and clear next steps.
This can be especially helpful if you're trying to make sense of what your ECG is really showing you. To learn more about what certain results might mean, check out our guide on the meaning of an abnormal ECG.
Common Questions About Reading Your ECG
We've covered a lot of ground together, and it's completely normal to still have a few questions bubbling up. Getting comfortable with reading your heart rate from an ECG is all about practice and having clear answers. Let's walk through some of the most common questions to help everything click into place.
Can I Diagnose a Condition With My Smartwatch?
No, and this is a really important distinction to make. Your smartwatch ECG is a fantastic tool for monitoring your heart, but it's not meant for self-diagnosis.
Think of it as a high-powered screening tool. It gives you incredible data to bring to a healthcare professional, who can then use it as part of a full evaluation. It helps you have a much more informed conversation with your doctor, but it absolutely does not replace a formal diagnosis from them.
How Is an ECG Heart Rate Different From a Regular Sensor?
Great question. Most of the time, your watch uses a light-based sensor (a technology called PPG) to guess your heart rate by looking at blood flow changes in your wrist. It’s a solid estimate for your pulse.
An ECG, on the other hand, is directly measuring your heart's electrical signals. This is a whole different level of detail. It not only gives you a heart rate but also provides critical information about your heart's rhythm, like whether it's regular or irregular, which a basic light sensor just can't see.
What if My ECG Reading Looks Messy?
Seeing a "noisy" or messy-looking ECG is incredibly common with personal devices, so don't panic. The best first move is simply to try again, but this time, focus on being as still and relaxed as possible.
Rest your arm on a table or your lap, make sure the watch is snug against your skin, and try not to talk or move during the 30-second recording. These simple tweaks are usually all it takes to get a much cleaner, more readable ECG.
Qaly provides expert, human-reviewed analysis of your smartwatch ECGs in minutes. Get peace of mind by understanding your heart's rhythm with help from certified professionals.


.png)
.png)