


Key Takeaways

User Profile
Hello Heart Hero.
So, how do you actually get that valuable Heart Rate Variability (HRV) number from an electrocardiogram (ECG)? It’s a multi-step dance that starts with a clean signal from your heart. We first have to pinpoint the highest point of each heartbeat (the R-peak), then precisely measure the time between those peaks (these are the RR intervals), and finally, run those numbers through some mathematical formulas. It’s how we turn the heart's raw electrical chatter into a clear story about your nervous system's health.
Your HRV Journey Starts Here
If you're feeling a bit overwhelmed by the streams of data coming from your wearable, you’re not alone. Many of us have felt let down by the traditional healthcare system, which is exactly why we've started seeking our own answers and taking control of our health. Think of this guide as a trusted friend on that journey. We're here to help you make sense of it all.
We’re going to break down how to calculate HRV from an ECG signal, step by step, and ditch the confusing jargon. HRV is so much more than a simple metric; it’s a direct look into your body's ability to handle stress and the delicate balance within your nervous system. You can dive deeper into the basics in our article on what is Heart Rate Variability.
Why an ECG Is the Gold Standard
While plenty of wearables track HRV, the quality of the data can vary wildly. For this kind of analysis, the ECG is widely considered the most reliable and accurate source of information. There’s a good reason for that.
- Direct Electrical Measurement: An ECG isn’t estimating anything. It directly records the heart's electrical pulses, giving you a crisp, unmistakable signal for every single beat.
- Precise Timing: This is the big one. To calculate HRV accurately, you need millisecond-level precision when identifying R-peaks. The ECG delivers that.
- Reduced Interference: Other methods, like the photoplethysmography (PPG) sensors that use light to measure blood flow, can be thrown off by simple things like movement or poor circulation. ECG is far more robust.
The science behind this has come a long way. Researchers really started digging into HRV from ECGs back in the late 1970s, evolving from just counting heartbeats to analyzing the tiny, meaningful variations between them. What once took rulers and painstaking manual calculations on paper strips is now automated, but the ECG has remained the undisputed gold standard for accuracy.
Your heart doesn’t beat like a metronome, and those tiny variations are where the story of your health is written. Understanding them starts with a clean, reliable signal, which is exactly what an ECG provides.
If you're feeling a bit overwhelmed by the streams of data coming from your wearable, you’re not alone. Many of us have felt let down by the traditional healthcare system, which is exactly why we've started seeking our own answers and taking control of our health. Think of this guide as a trusted friend on that journey. We're here to help you make sense of it all.
We’re going to break down how to calculate HRV from an ECG signal, step by step, and ditch the confusing jargon. HRV is so much more than a simple metric; it’s a direct look into your body's ability to handle stress and the delicate balance within your nervous system.
Preparing Your ECG Signal for Analysis
Before you can calculate anything meaningful, you need a clean, reliable ECG signal. This isn't just a technical step; it’s the foundation for everything that follows. Think of it like trying to listen to your favorite song on the radio, you have to tune out the static to hear the music clearly.
Your raw ECG recording from a wearable device contains your heart's pure electrical activity, but it also picks up "noise." This noise can come from simple things like shifting in your chair, moving your arm, or even electrical interference from nearby electronics. If you have a Kardia device, you can learn how to get your raw data in our guide on how to export your ECGs from Kardia.
Common Signal Interferences
Two of the most common types of noise you’ll encounter are movement artifacts and baseline wander. Movement artifacts are sharp, erratic spikes caused by physical motion. Baseline wander is a slower, wave-like drift in the signal, often caused by breathing or slight changes in electrode contact.
These interferences can easily trick analysis software into misidentifying the peaks of your heartbeat, called R-peaks. A misidentified peak throws off the timing between beats, and since HRV is all about those tiny time variations, even a few errors can distort your results. Filtering your ECG signal is how you clean up this noise.
The goal of signal preparation isn't to change your heart’s signal, but to remove everything that isn’t your heart's signal. A clean recording ensures the HRV numbers you calculate truly reflect your body's inner workings.
Tips for a Cleaner Recording
Getting a high-quality ECG from a wearable is pretty straightforward if you follow a few simple practices. These small actions can dramatically reduce the amount of noise in your data right from the start.
- Stay Still and Relaxed: Find a comfortable seated position where you can rest your arm on a table. Try not to talk or make any significant movements while the recording is in progress.
- Ensure Good Contact: Make sure the device's sensors have firm, consistent contact with your skin. For watch-style devices, this means a snug but not overly tight fit. For handheld devices, maintain steady pressure.
- Breathe Normally: Holding your breath or taking unusually deep breaths can cause that baseline wander we talked about. Just breathe at a natural, calm pace.
By focusing on getting a clean signal first, you set yourself up for success. You’ll have more confidence in your data, leading to a much more accurate and insightful HRV analysis.

Finding the R-Peaks in Your ECG Waveform
This is where the magic really begins. After cleaning up your data, the next critical task in learning how to calculate HRV from ECG is identifying the precise moment of each heartbeat. The entire foundation of your analysis rests on accurately finding the R-peaks in your ECG waveform.
Think of an R-peak as the most prominent electrical signal your heart produces. On a graph, it’s the tallest, sharpest spike you see with each beat. Finding these peaks is absolutely essential because the time between them is exactly what we use to measure your HRV.
Why Pinpoint Accuracy Is Everything
The difference between a calm, recovered state and a stressed-out one can be measured in milliseconds. If the software you're using misses an R-peak or, just as bad, detects a fake one where there isn’t one, it can completely throw off your results. It's okay to feel concerned about getting it right, and we're here to help you understand why it matters.
Imagine your heart is beating at a steady 60 beats per minute. That means there's about 1,000 milliseconds between each beat. A tiny error of just 50 milliseconds from a misplaced R-peak might not sound like much, but it can be the difference between a reading that shows you're relaxed and one that falsely suggests you’re under stress.
A single missed or incorrectly placed R-peak can create a domino effect, corrupting your final HRV numbers and painting a wildly inaccurate picture of your nervous system's health. This is exactly why starting with a clean, clear signal is non-negotiable.
The Logic Behind R-Peak Detection
So, how do we actually find these tiny but mighty peaks? Most modern algorithms don't just look for the highest point in the signal, they're much smarter than that. They search for a combination of features that are unique to a true R-peak.
This process involves looking for:
- A Steep Slope: A genuine R-peak has a very rapid rise and fall. Algorithms are trained to look for this sharp incline, which helps distinguish it from the slower, more rounded waves in the ECG.
- High Amplitude: The R-peak is almost always the tallest part of the signal. The detection logic will set a threshold to ignore smaller bumps and random noise.
- Specific Timing: Software also knows that heartbeats generally follow a rhythm. It looks for peaks that fall within an expected time window, which helps it ignore random noise that might look like a peak but doesn't fit the overall pattern.
These R-peaks are part of a larger electrical event called the QRS complex. Understanding this entire complex can offer even deeper insights into your heart's function. For those interested, you can learn more about the QRS interval on your watch ECG in our detailed guide.
Let’s think about a real-world scenario. Say you coughed while recording your ECG. This movement can create a sudden, sharp spike in the data. A simple algorithm might mistake that artifact for an R-peak. But a more robust method will see that the spike doesn’t have the characteristic shape or steepness of a true R-peak and will correctly ignore it. This kind of intelligent filtering is what gives you data you can actually trust.

Once you’ve nailed down the R-peaks in your ECG data, the next critical step is to calculate the exact time between each of those peaks. This measurement is known as the RR interval, and it’s the fundamental building block for every HRV metric you'll calculate. Think of this step as turning a simple list of timestamps into a meaningful story of your heart's beat-to-beat changes.
We're moving beyond just your average heart rate here. This is about zooming in on the tiny, millisecond-level differences between each and every heartbeat. Those subtle variations are the language of your nervous system, and measuring them accurately is everything.
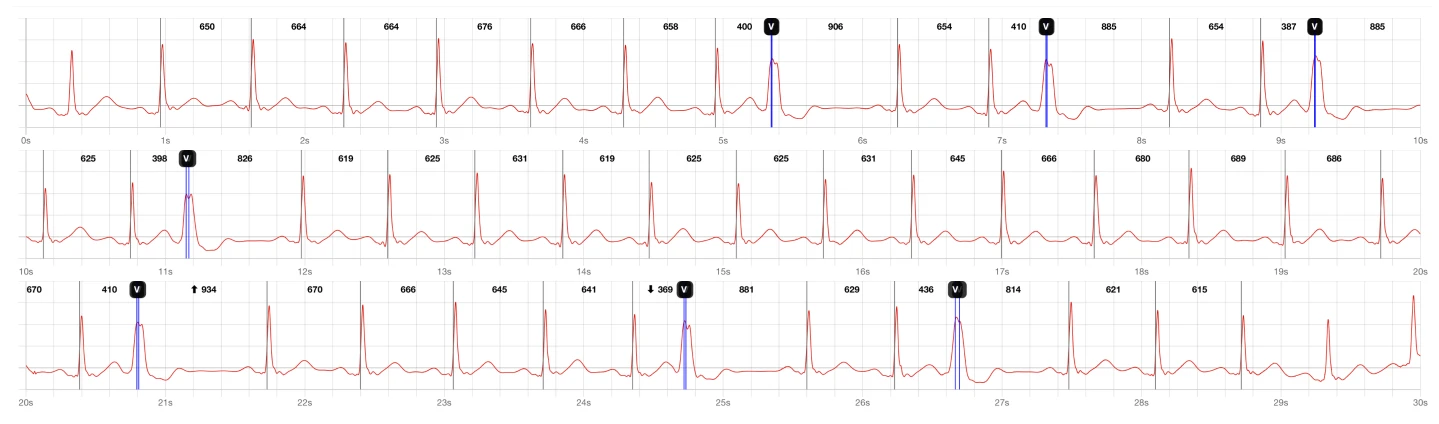
This visual shows the basic but crucial workflow: taking a raw ECG signal, finding the R-peaks, and marking them. This sets you up perfectly for calculating the intervals between those marks.


From Peaks to a List of Intervals
Let's walk through a quick, practical example. Imagine your analysis tool has tagged R-peaks at these timestamps (in milliseconds): 500, 1300, 2150, and 2900.
To get the RR intervals, it's just simple subtraction.
First RR Interval: 1300 ms minus 500 ms equals 800 ms, Second RR Interval: 2150 ms minus 1300 ms equals 850 ms, Third RR Interval: 2900 ms minus 2150 ms equals 750 ms
This leaves you with a clean list of RR intervals: [800, 850, 750]. This series of numbers, not the peaks themselves, is the raw data you'll feed into your HRV calculations.
Dealing with Irregular Beats and Artifacts
Now, this is where things can get tricky and where many analyses go wrong. What happens if your ECG recording has some noise, an artifact from movement, or an actual irregular beat? These outliers can create bizarrely long or short RR intervals that have nothing to do with your nervous system's actual state, completely skewing your results.
For instance, a sudden movement might create a false peak, or an ectopic beat like a Premature Ventricular Contraction (PVC) could throw off the rhythm. You can learn more about these common irregularities in our guide about Premature Ventricular Contractions (PVCs). If you don't account for these events, they can massively inflate or deflate your final HRV scores.
It's absolutely essential to clean your RR interval data before analysis. Removing or correcting these outliers ensures that the final metrics you calculate are a true representation of your physiological state, not just random noise.
This isn't just a modern "best practice", it's a foundational principle in the field. Since 1996, a standardized approach has guided HRV measurement, demanding the careful identification and removal of artifacts and extrasystoles before any calculations are done. This ensures that when we all talk about HRV, we're speaking the same language and using data that truly reflects the heart’s natural rhythm.
By taking the time to turn your R-peaks into a clean list of RR intervals, you're building a solid, reliable foundation for the most insightful part of the process.
Calculating and Understanding Your HRV Metrics
You’ve put in the work, collecting, cleaning, and prepping your ECG data. Now comes the fun part, where we turn that clean list of RR intervals into numbers that tell a powerful story about your body.
It’s completely normal to feel a little overwhelmed by all the different metrics at first. But let's break them down. Think of these numbers less like complex medical jargon and more like messages from your nervous system. Our goal is to help you tune in and understand what your body is trying to tell you.
Time-Domain Metrics: What Your Body Is Doing Right Now
Time-domain metrics are the most direct way to look at your HRV. They measure the raw amount of variation in your RR intervals over a specific time. They're fantastic for getting a quick snapshot of your body's current state of stress and recovery.
Two of the most common and important ones you'll see are:
- SDNN (Standard Deviation of NN intervals): This gives you the big-picture view. SDNN measures the overall variation in your heartbeats across the entire recording. A higher SDNN generally means your body is more adaptable and resilient to both physical and mental stress.
- RMSSD (Root Mean Square of Successive Differences): This one zooms in on the short-term, beat-to-beat changes. RMSSD is a key indicator of your parasympathetic nervous system activity, the "rest and digest" side of things. A higher RMSSD is often a great sign that your body is in a state of recovery and relaxation.
For example, if you see your RMSSD jump up after a solid night's sleep, that's a clear signal your body is bouncing back effectively. On the flip side, a consistently low RMSSD might be your body's way of telling you you're carrying too much stress without enough downtime.
Frequency-Domain Metrics: The Deeper Story
This is where things get a bit more abstract, but the insights are just as powerful. Frequency-domain analysis is kind of like separating a piece of music into its different instruments. It breaks down your RR interval data into different frequency bands, each tied to a specific part of your nervous system.
Think of your nervous system as having two main branches playing off each other: a gas pedal and a brake. Frequency-domain metrics help you see which one is being pushed more at any given moment, giving you a deeper look at your body's inner balance.
Here are the two main "frequencies" you'll be looking at:
- High Frequency (HF) Power: This is almost entirely driven by your parasympathetic ("rest and digest") nervous system. It’s also closely linked to your breathing patterns. Strong HF power is a good sign, typically indicating you're calm and well-recovered.
- Low Frequency (LF) Power: This band is a little more complex, as it reflects activity from both the sympathetic ("fight or flight") and parasympathetic systems. It’s often associated with how your body regulates blood pressure.
Getting a handle on your HRV metrics can unlock insights into your body's physiological responses, including how it reacts to practices like specific breathing exercises to lower heart rate. By seeing how these numbers shift, you can start connecting your daily habits to your internal state, empowering you to make choices that truly support your well-being.
Common Questions About Calculating HRV from an ECG
When you first start digging into your own health data, it's natural for questions to come up. This journey of understanding your body is a personal one, and it's totally normal to feel a bit uncertain at times. Let's tackle some of the most common questions to help you feel more confident.
Learning how to calculate HRV from an ECG might seem daunting, but once you get the hang of the core concepts, it becomes much clearer. The biggest step is the one you've already taken: deciding to learn more for yourself.
How Accurate Is HRV from a Wearable Device?
This is a fantastic and important question. The gold standard for measuring HRV is a clinical-grade electrocardiogram (ECG). But here's the good news: modern consumer wearables, especially those with ECG tech like many smartwatches, have gotten incredibly good.
While they might not be on the same level as a multi-lead hospital ECG, they're widely considered reliable enough for personal health tracking. The real trick is consistency. By taking your reading with the same device around the same time each day, you establish a solid baseline. This allows you to track trends, which is often far more insightful than any single reading.
The real power isn't in a single "perfect" measurement. It's in watching the patterns and shifts in your HRV over days and weeks. This is what truly shows how your body is responding to your lifestyle, stress, and recovery.
What Is a Good HRV Score?
This is probably the number one question we hear, and the most honest answer is: it’s completely personal. There is no magic number or universal "good" HRV score. Your healthy range is unique to you and depends on a bunch of factors.
- Age: HRV naturally decreases as we get older. A 20-year-old’s average HRV is going to look very different from a 60-year-old’s.
- Genetics: Like it or not, a good chunk of your baseline HRV is simply baked into your DNA.
- Lifestyle: This is where you have the most control. Your fitness level, how well you sleep, and what you eat all have a huge impact.
Instead of getting caught up comparing your numbers to others, focus on your own personal trends. A gradual upward trend over a few weeks is a fantastic sign. On the flip side, a sustained dip could be your body's way of signaling that it needs more rest and recovery.
Feeling unsure about your ECG readings? Don't leave your peace of mind to chance. With Qaly, you can have your wearable ECGs analyzed by certified human experts in minutes, any time of day.


.png)
.png)