

Key Takeaways

User Profile
Hello Heart Hero.
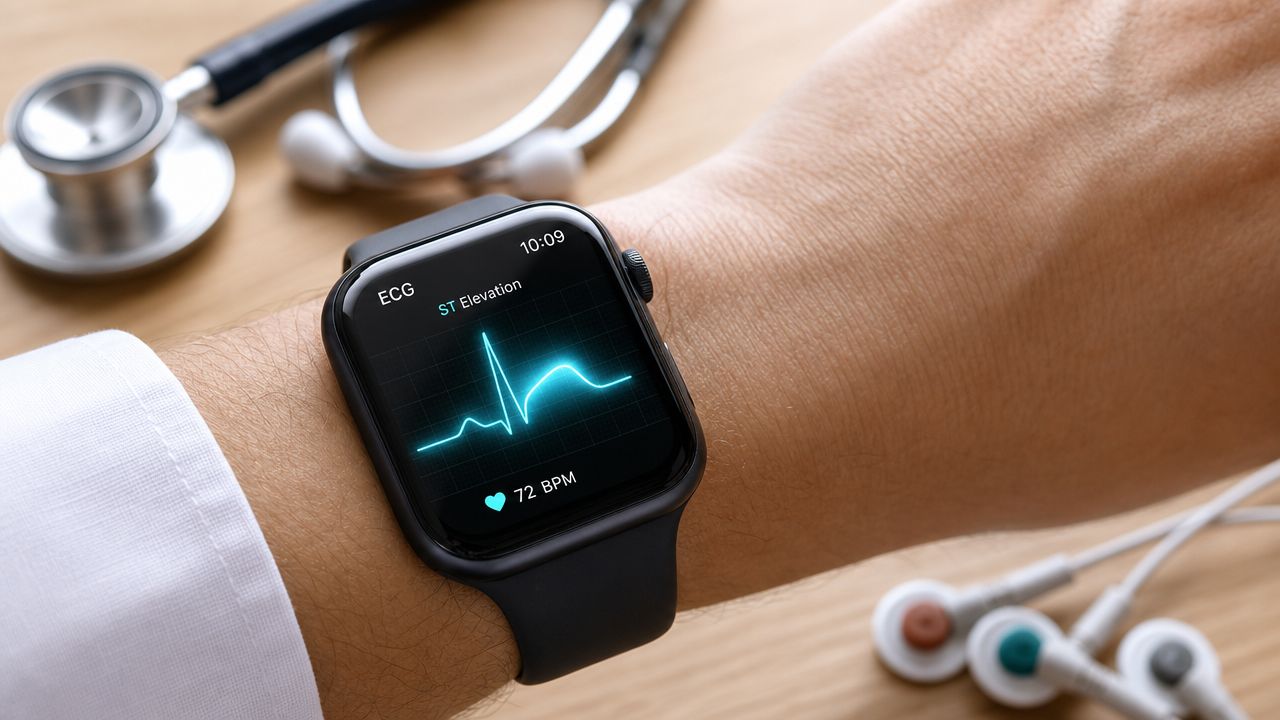
You took an ECG on your Apple Watch, Kardia, Fitbit, Samsung watch, or another wearable because something felt off. Or maybe nothing felt off, and you were just curious. Then you noticed a dip after the main spike, searched for it, and landed on the phrase Upsloping ST depression.
That phrase can sound serious fast.
What makes it harder is that most explanations online were written for hospital ECGs or treadmill stress tests, not for people staring at a single-lead tracing on a phone. So you end up caught between two unhelpful extremes. One page says it's harmless. Another makes it sound like blocked arteries until proven otherwise.
The situation is more nuanced, and that's good news. A wearable ECG can raise a useful question, but it usually can't answer that question by itself. With upsloping ST depression, the details matter. The shape matters. Your heart rate matters. Whether the slope is slow or rapid matters. And the context of when you captured it matters a lot.
If you're worried, skeptical, and trying to make sense of your own data before you get brushed off or overwhelmed, you're in the right place.
A Guide to Upsloping ST Depression on Your ECG
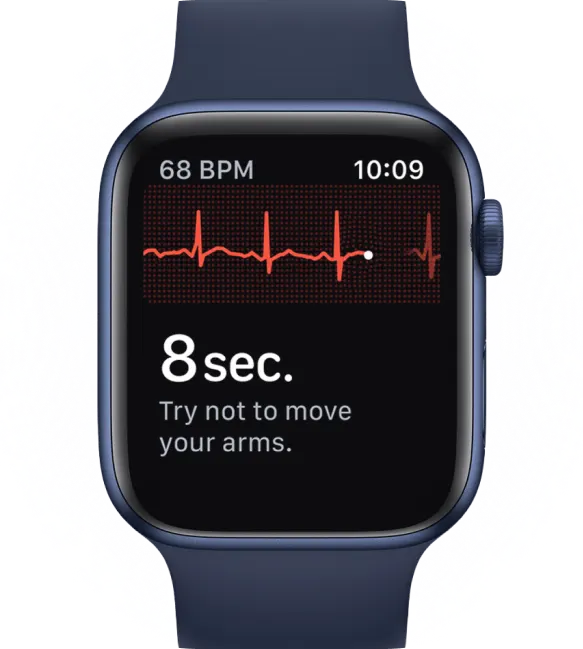
A common real-life moment goes like this. You feel a flutter, a skipped beat, a strange tightness, or just a wave of anxiety. You open your wearable ECG app, hold still, and record a strip. Later, while zooming in, you notice the line after the main spike seems lower than expected, then slowly climbs upward. Now you're searching screenshots, forums, and medical terms at midnight.
That reaction makes sense.
Upsloping ST depression describes a shape on the ECG. It is not a diagnosis by itself. For wearable users, that distinction is especially important because a single-lead tracing is a small slice of information, not the full clinical picture.
A wearable ECG is best treated like a health journal entry. It can capture something worth paying attention to, but it usually can't tell you the full reason on its own.
People often get stuck on one question. “Is this normal or dangerous?” The frustrating answer is that it can be either less concerning or more meaningful depending on the exact pattern and the situation around it. That doesn't mean the finding is useless. It means the right interpretation depends on more than one screenshot.
Why wearable users get confused
Most public explanations blur together all forms of upsloping ST depression. They don't separate rapid upsloping from slow upsloping, and they rarely explain what a watch can and can't reliably show.
That's the gap this article tries to fix.
You don't need to become a cardiology expert to think clearly about your tracing. You just need a practical framework. First, understand what the ST segment is. Then learn what “upsloping” looks like. Then ask whether the pattern could be a mimic, an artifact, a fast-heart-rate effect, or something that deserves professional review.
What Is the ST Segment on Your ECG
Think of one heartbeat on your ECG as a short electrical story.
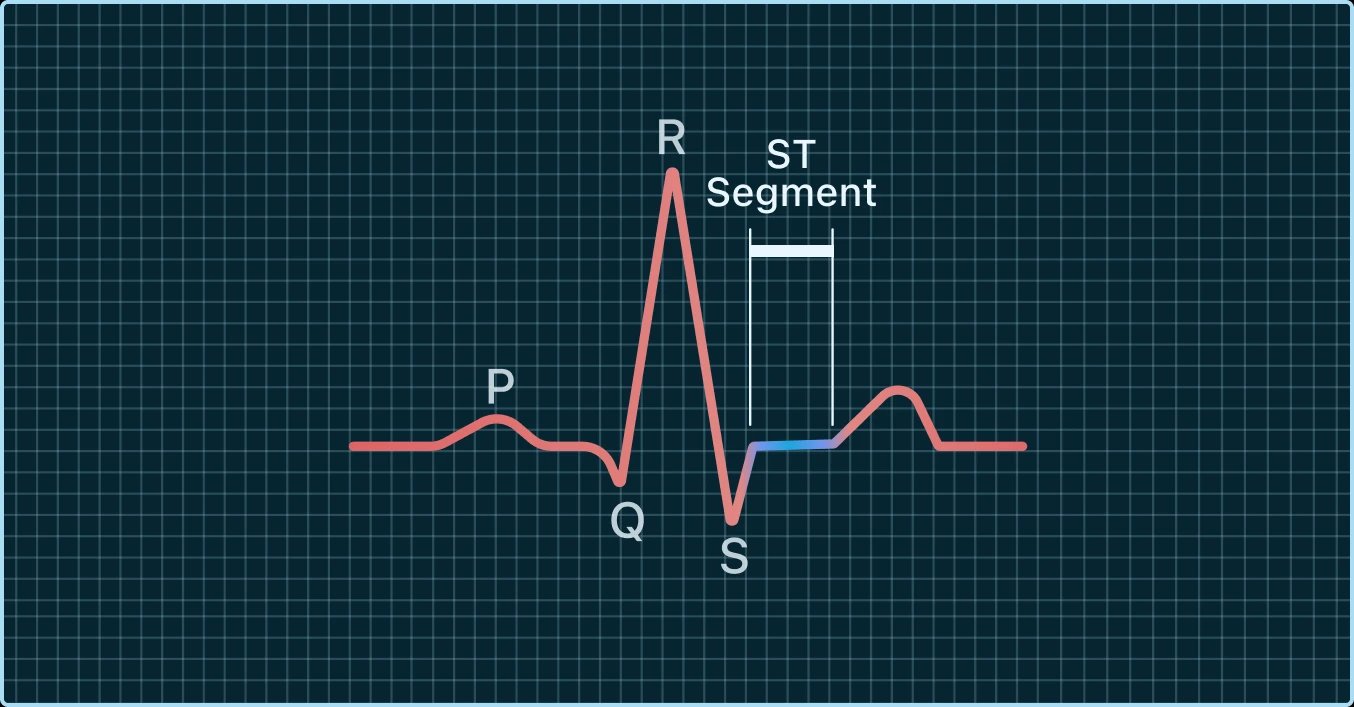
The small bump is the P wave. The tall sharp spike is the QRS complex. The later rounded bump is the T wave. The ST segment sits between the QRS complex and the T wave. If you want a fuller introduction to the basic parts of an ECG, this guide on how to read an ECG is a helpful companion.
This visual can help you orient yourself first.
The simplest way to picture it
A useful analogy is to think of the QRS complex as the big action moment, when the heart's main pumping chambers activate. The ST segment is the brief stretch right after that. Many patients find it easiest to think of it as a short recharging phase before the next visible part of the beat.
On a typical ECG, that segment usually looks fairly level with the baseline. If it sits lower than expected, that's called ST depression.
What makes people uneasy is the word “depression.” In ECG language, it doesn't mean emotional distress. It just means the line is visually lower than the usual reference line.
What you're actually looking for
When you inspect your tracing, look for three landmarks:
- The big spike: This is the QRS complex.
- The point where the spike ends: This transition point is called the J-point.
- The stretch after that: This is the ST segment, before the T wave rises.
Later in the article, the J-point becomes important because that's where experts start judging the slope of the ST segment.
A short video explanation can also make the waveform easier to recognize.
Practical rule: Before you worry about a pattern, make sure you know which part of the tracing you're looking at. Many wearable users mistake the end of the QRS or the start of the T wave for the ST segment.
Benign Mimics vs Concerning Signs
Shape matters. A lot.
When clinicians talk about ST depression, they don't just ask whether the line dipped. They ask how it dipped after the J-point. That shape can point in different directions, both visually and clinically.
Three common shapes
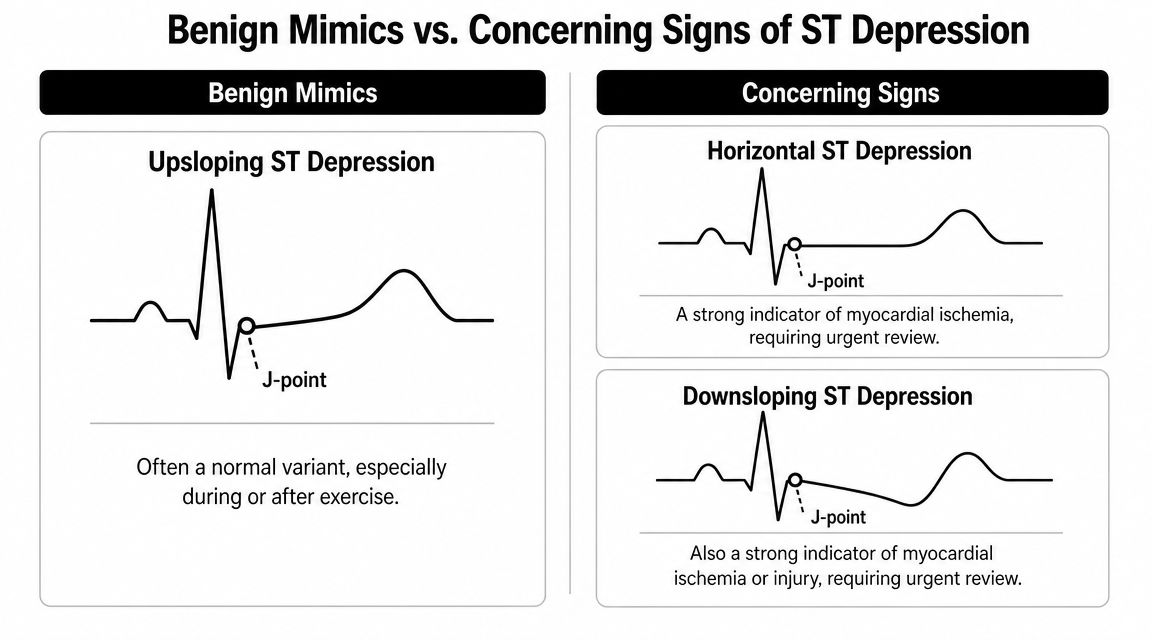
After the J-point, the ST segment may look like one of these broad patterns:
- Upsloping: The line starts low, then climbs upward toward baseline. Think of a ramp.
- Horizontal: The line stays flat, but lower than baseline.
- Downsloping: The line continues downward after the J-point.
That's why two people can both say, “I have ST depression,” while showing very different tracings.


Why wearables complicate this
On a hospital 12-lead ECG, multiple angles help confirm whether a shape is real and where it appears. On a single-lead wearable, you only get one view. Small motion, skin contact problems, or baseline wobble can make one shape resemble another.
Non-heart causes can also distort the tracing. If you've ever wondered whether minerals, hydration, or related issues can affect an ECG pattern, this article on electrolyte imbalance and your ECG adds helpful background.
Here's the key point for worried wearable users. Upsloping is not automatically reassuring, but it also isn't automatically alarming. It sits in a gray zone where speed of the rise, depth of the dip, timing after the J-point, and the clinical setting all matter.
On a watch ECG, the same little dip can mean “normal during a fast heartbeat,” “recording artifact,” or “worth a closer look.” The tracing alone often can't sort those out.
Why Is Your ECG Showing Upsloping ST Depression
A common initial fear is reduced blood flow to the heart. That is one possibility. It is not the only one.
According to the overview of ST depression causes, ST depression can appear with ischemia, but it can also occur with tachycardia, hyperventilation, hypokalemia, digoxin, conduction abnormalities, and artifact from poor electrode contact. For wearable users, that last one matters more than many people realize.
Common non-ischemic reasons
A watch tracing can show an upsloping ST pattern for reasons that have little or nothing to do with a dangerous blockage.
- Fast heart rate: If you recorded during exercise, after climbing stairs, after caffeine, during a panic episode, or while your heart was racing for any reason, the ST segment can change appearance.
- Breathing effects: Hyperventilation can alter the tracing.
- Electrolyte shifts: Low potassium is one example that can affect ECG appearance.
- Medication effect: Digoxin is a classic medication associated with ST changes.
- Electrical conduction differences: Some baseline ECG patterns make ST segments harder to interpret.
- Artifact: Poor skin contact, dry skin, loose positioning, movement, or muscle tension can imitate a dip.
What artifact looks like in real life
Artifact is one of the biggest blind spots for people using smartwatches and handheld devices at home. If your wrist is tense, your finger pressure changes, or the baseline drifts, the ST segment may look lower than it really is.
That's why a single screenshot can be misleading. The tracing may reflect your setup more than your heart.
A practical check is to compare context. Did the pattern show up only once while you were moving, anxious, or adjusting your grip? Or does it appear repeatedly in calm, still recordings with clean baseline quality? Repetition doesn't prove danger, but it does make the finding more worth reviewing.
When ischemia stays on the list
Reduced blood flow, also called ischemia, is still part of the differential. That's especially true if the tracing was captured during symptoms such as chest pressure, breathlessness, or exertional discomfort. But for a wearable user, it's rarely wise to jump straight from “I see a dip” to “I know the cause.”
That gap between signal and explanation is why context matters so much.
The Clinical Meaning of Slow vs Rapid Upsloping
This is the part that usually gets oversimplified online.
Many people are told that upsloping ST depression is benign. Others read that it can still point to coronary artery disease. Both statements contain some truth, and the missing piece is which type of upsloping pattern you're talking about.
Rapid upsloping and slow upsloping are not the same
A rapid upsloping pattern rises back toward baseline quickly after the J-point. In exercise settings, that pattern is often treated as less concerning.
A slow upsloping pattern climbs back more gradually. That slower ramp is where the debate has lived for years. Historically, clinicians often treated upsloping changes as less specific than horizontal or downsloping ST depression. But later evidence showed that dismissing all upsloping patterns can miss meaningful findings.
A review of prior studies found that when 1 mm upsloping ST depression at 70 ms after the J-point was counted as abnormal, exercise-ECG sensitivity improved. Compared with coronary angiography, sensitivity increased from 67% to 77%, while specificity remained 92%, as reported in this review on upsloping ST depression and CAD detection. The same review concluded that including upsloping changes increased exercise-ECG sensitivity by about 15% without much loss of specificity.
Why that doesn't mean every wearable finding is dangerous
Those numbers come from structured exercise testing and clinical comparisons, not from a single-lead watch recording at home. That distinction matters.
The practical takeaway is not “all upsloping ST depression is bad.” The takeaway is that slow upsloping shouldn't be automatically dismissed, especially in the right clinical context.
Some clinicians also note that slow upsloping patterns may need a larger depression threshold, around 1.5 to 2.0 mm at 80 ms after the J-point, to reduce false positives, while rapid upsloping depression is often non-ischemic, as discussed in this expert explanation of measuring and interpreting upsloping ST depression.
For patients trying to understand the bigger picture of reduced blood flow, this plain-language article on ischemia of the heart can help connect the ECG term to what doctors mean clinically.
A study that reassures, with an important caveat
A Johns Hopkins study looked at patients undergoing exercise testing and found that ischemia occurred in 39% in one low-risk upsloping group and 25% in another, compared with 77% in a group with more concerning findings. Transient ischemic dilation was 0%, 3%, and 23% across those groups. The authors concluded that slow upsloping ST depression did not indicate more severe ischemia, more extensive CAD, or more stress-induced left ventricular failure, and that these patients could reasonably be considered to have a very low likelihood of CAD, similar to rapid upsloping ST depression, according to the Johns Hopkins exercise-testing study.
So yes, there is reassurance here.
But there is also nuance. The same broad category of “upsloping” can include patterns that are often benign and patterns that still add diagnostic information in the right setting. For a wearable user, that means you usually can't settle the question by eyeballing one beat on your phone.
What To Do After Seeing Upsloping ST Depression
When you see a concerning-looking shape on your watch ECG, the goal isn't to diagnose yourself. The goal is to collect better information.
Start with context, not panic
Write down what was happening at the time of the tracing.
- Activity: Were you walking, exercising, climbing stairs, or lying in bed?
- Symptoms: Did you have chest pain, chest pressure, shortness of breath, dizziness, palpitations, nausea, or nothing at all?
- Body state: Were you anxious, shaking, breathing fast, or dehydrated?
- Medications: Had you recently taken any medicine that might affect heart rate or ECG appearance?
That context is often more useful than the tracing alone.
Take a cleaner repeat recording
If you feel stable, repeat the ECG after a few minutes.
Sit down. Rest your arm on a table. Relax your shoulders and hand. Breathe normally. Make sure the device has good skin contact. Then record again without talking or moving.
If the pattern disappears on a calmer, cleaner tracing, artifact or rate-related change becomes more plausible. If it keeps appearing, that doesn't prove danger, but it does strengthen the case for review.
Save the original tracing and the repeat tracing. A comparison between the two is often more informative than either one by itself.
Know when to get urgent help
A wearable ECG should never delay emergency care.
Seek urgent medical attention if the tracing appears abnormal and you also have symptoms such as chest pain, severe shortness of breath, fainting, near-fainting, or a strong sense that something is seriously wrong. In that situation, your symptoms matter more than your interpretation of the waveform.
If you feel well and this was an isolated finding, the next step is usually to save the ECG, document the circumstances, and share it with a clinician who can interpret it in context.
How Qaly's Experts Analyze Your Wearable ECG
Upsloping ST depression is exactly the kind of finding that exposes the gap between what a wearable can capture and what a person can reliably conclude from it.
A trained reviewer doesn't just ask, “Is the ST segment below baseline?” They look at whether the tracing is clean enough to judge. They check the morphology around the J-point. They look for whether the rise appears rapid or slow. They consider heart rate, the rest of the waveform, and any notes about symptoms or exercise. That extra layer matters because single-lead recordings can blur together artifact, normal variation, and important changes.
For broader background on the strengths and limits of smartwatch recordings, this guide to a cardiologist's view of the smartwatch ECG is worth reading.

If you want human review of a wearable ECG, one option is Qaly, which lets users upload recordings from devices like Apple Watch, Kardia, Fitbit, and others for review by certified cardiographic technicians. In a case like suspected upsloping ST depression, that kind of review can help sort out whether the tracing looks more like artifact, a less concerning rate-related change, or something that should be taken to your doctor for further evaluation.
The most important mindset is this: your watch gave you a clue. It did not hand you a verdict.
Got ECG questions? Get human-reviewed answers. Upload your tracing + symptoms.


.png)
.png)