


Key Takeaways

User Profile
Hello Heart Hero. You're probably staring at an echo report, seeing pressure half time, and wondering whether that one number tells you how worried you should be. It's a very normal reaction, especially when the report feels clinical and the meaning isn't obvious.
What follows is a plain-language guide to aortic regurgitation pressure half time, written the way I'd explain it in clinic to someone who's already done the Googling and still doesn't feel settled. The short version is simple, this number can be useful, but it's only one clue in a bigger physiology story. If you want the broader context of how a transthoracic echo is performed, this overview of the test helps put the measurement into place.
Hello Heart Hero and Welcome to This Guide
You've got the report open, and the number sits there on the page like it ought to settle everything. That reaction makes sense. A single Doppler measurement feels firmer than a paragraph about valve leakage, heart relaxation, and changing loading conditions.
Aortic regurgitation pressure half time is one of those measurements that looks more certain than it is. It describes how quickly the pressure difference across a leaky aortic valve falls after the heart relaxes, which gives a clue about how the jet behaves on that scan. On a report, you may see a value written in milliseconds, sometimes with a shorter number suggesting faster pressure equalization and a longer one suggesting slower equalization.
A value in the roughly 500 millisecond range often gets read differently from a value closer to 200 milliseconds, but the number never stands alone. Blood pressure, heart rate, and left ventricular stiffness can all change what that tracing means from one study to the next, so two reports that look similar on the surface may not be telling the same physiologic story.
That is why a careful reading of the measurement starts with context. If you want a simple refresher on how the echo exam fits together before you focus on one Doppler line, this overview of transthoracic echocardiography is a good place to orient yourself.
For a broader look at valve disease in general, this explainer on valvular heart disease can help anchor the terms before you get lost in the details.
The Physiology Behind Pressure Half Time
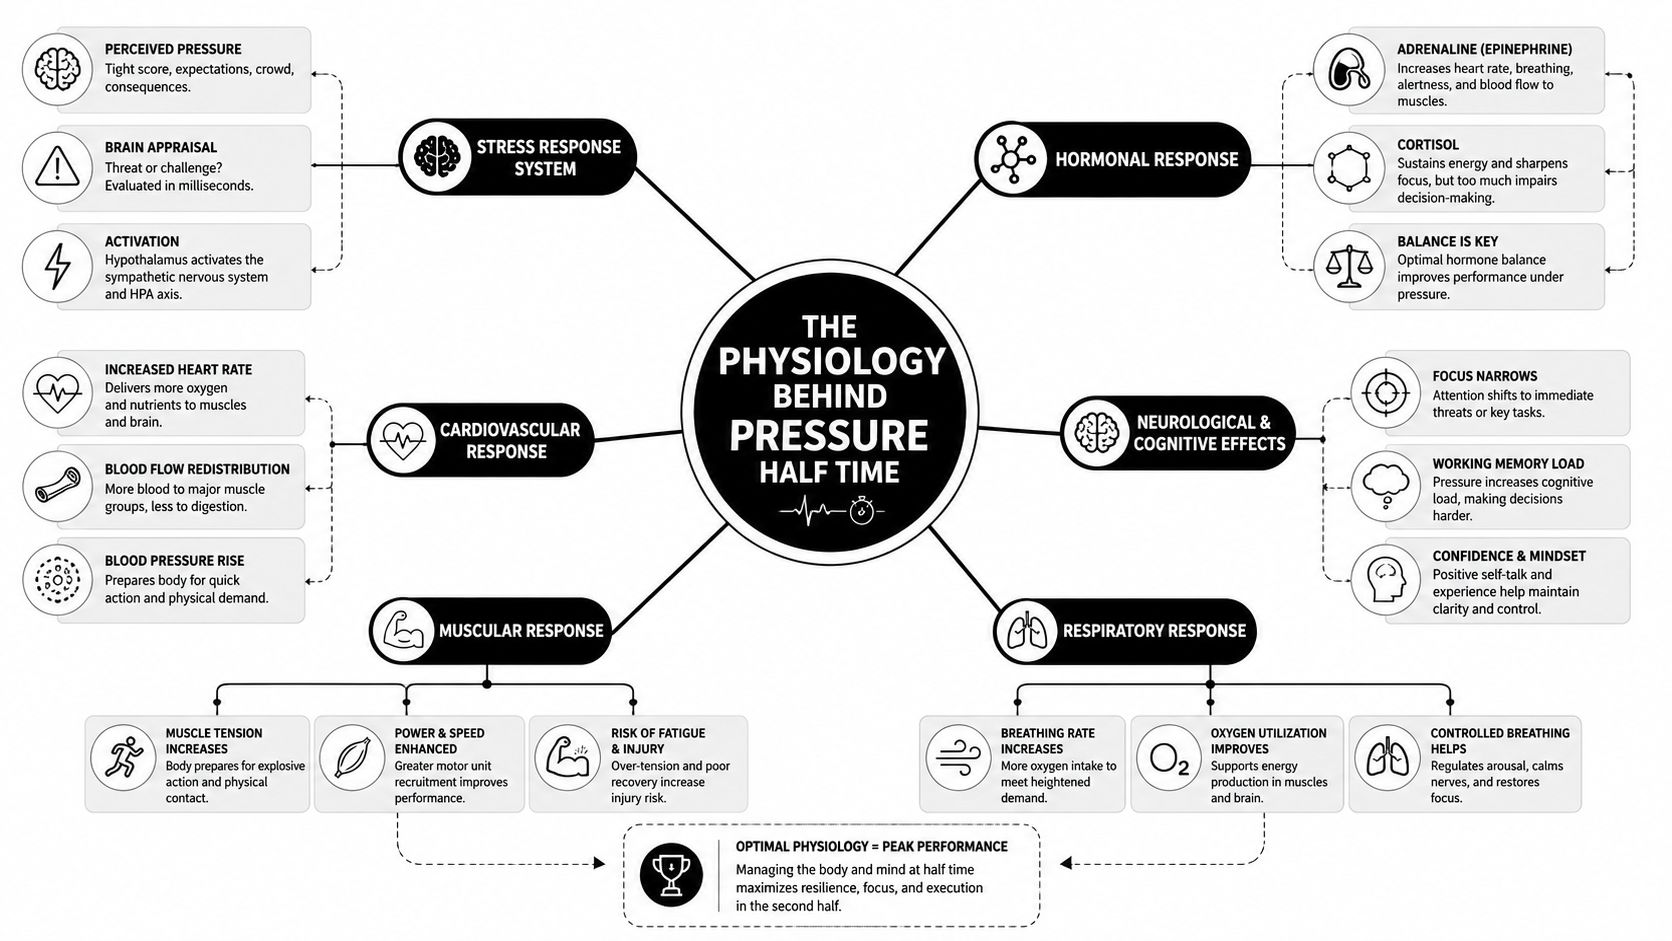
A leak in the aortic valve changes the pressure conversation between the aorta and the left ventricle. During diastole, the ventricle should relax and fill, but in aortic regurgitation some blood slips backward through the imperfect seal, so pressure on both sides starts to drift toward the same level.
That drifting is what pressure half time tries to capture. The Doppler tracing begins with a large pressure gap, then slopes downward as that gap shrinks. The measurement is the time it takes for the original difference to fall by half, so a shorter time usually means the pressures are equalizing more quickly.
The simplest way to picture it is not as a perfect scorecard, but as a moving river of pressure. A wider opening lets the pressures meet sooner, while a smaller opening tends to slow the process. That is why a more severe leak often produces a steeper slope and a shorter half time, as described in the ASE valvular regurgitation guideline guideline PDF for chronic aortic regurgitation.
The intuition in one sentence
Pressure half time is a story about how quickly the aorta and left ventricle drift toward the same pressure during diastole.
That story changes with physiology. A stiff left ventricle can make the number look different, high blood pressure can change the pressure gradient, and a faster or slower heart rate can alter the conditions under which the tracing is recorded. So the number is a clue about pressure behavior, not a final verdict about how large the leak is.
For readers who want a broader anchor before focusing on one Doppler measure, this heart echocardiogram guide can help connect the terms without turning the discussion into a glossary.
How Sonographers Measure It
A sonographer measures pressure half time during Doppler ultrasound by following the regurgitant jet on the spectral display and finding the point where the pressure gradient has fallen to half of its starting value. If you want a broader refresher on how an echo exam is put together, this heart echocardiogram guide can help make the parts feel less abstract. In practice, the operator usually uses continuous-wave Doppler for this measurement, because the regurgitant signal is often best captured with an uninterrupted Doppler beam rather than a sampled one.
The tracing starts as a bright, sloping curve on the screen. The sonographer places the Doppler cursor through the aortic regurgitant jet, then positions the sample gate, or sample volume, where the jet is most clearly seen, often at the tip of the aortic valve leaflets or along the line of the jet in the apical view. From there, the machine marks the slope of the curve and calculates the time it takes for the initial pressure difference to fall by half. The result is reported in milliseconds.
Why the tracing can vary from one day to another
Small technical changes can change what the tracing looks like. If the ultrasound beam is not aligned well with the jet, the slope can appear different. If the gain is set too high, the spectral envelope can become harder to read. If the patient is breathing differently, the recording can shift a little.
Body conditions matter too. Blood pressure, heart rate, and left ventricular stiffness can all change how quickly the aorta and ventricle approach the same pressure during diastole, so the number may move even when the valve itself has not suddenly changed. That is why pressure half time should be read as part of the physiology at the bedside, not as a fixed label stamped onto the valve.
Clinical reminder: this is a standard echo measurement, but it is not a number you can generate from a smartwatch or a consumer wearable.
What the machine is really doing
- Capturing the leak signal so the regurgitant jet can be seen on Doppler.
- Tracing the slope as the pressure gradient falls during diastole.
- Reporting the half time in a unit clinicians can compare with other echo signs.
The useful part is not the number alone. It is the way the tracing fits with the rest of the scan, because the same value can look different depending on blood pressure or heart rate at the moment the image is recorded. Sonographers and cardiologists use it as one clue in a larger interpretation, not as a stand-alone answer.
Reading the Numbers on Your Report
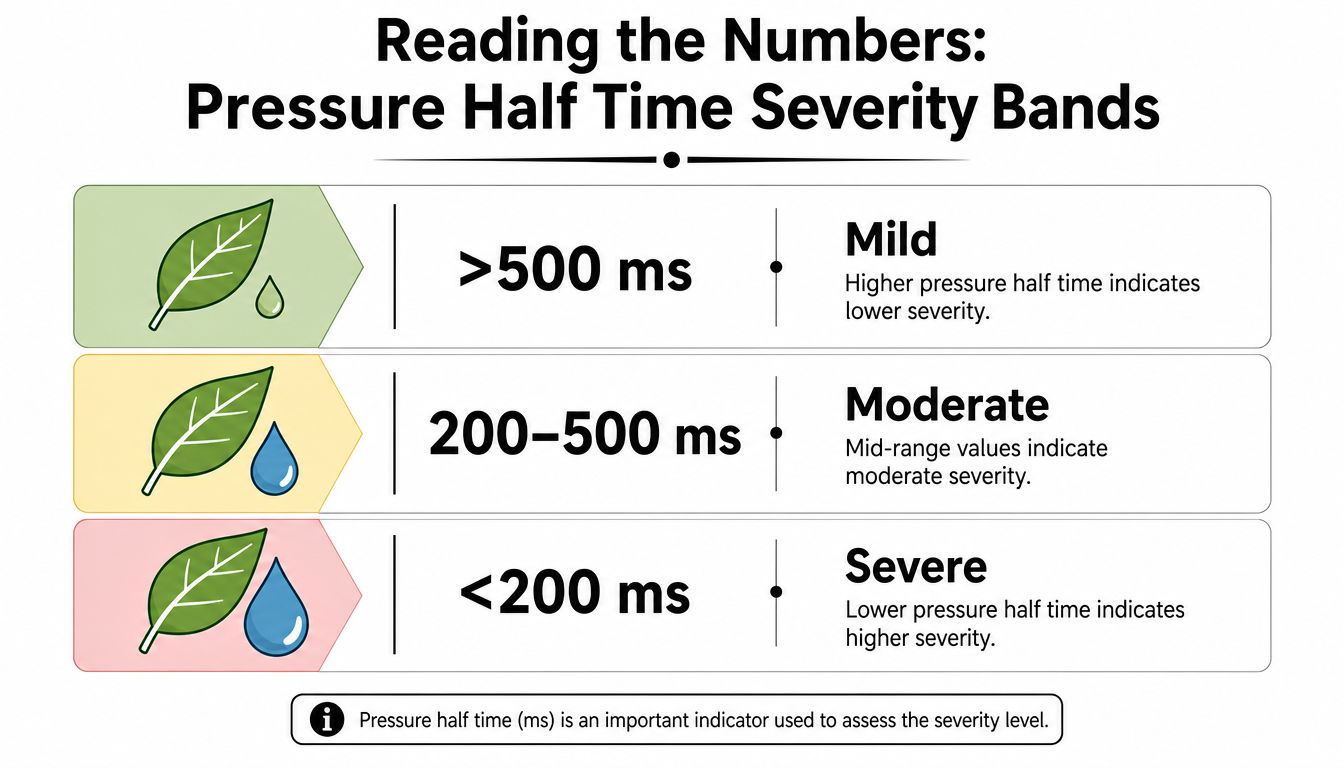
A report can look deceptively simple here. A pressure half time above 500 ms usually fits mild aortic regurgitation, 200 to 500 ms usually fits moderate, and less than 200 ms usually points toward severe disease. That is the basic pattern described in the ASE guideline for chronic aortic regurgitation.
That framework gives you a starting point. If you only have the number, it at least tells you where the Doppler slope sits on the usual spectrum. The harder part is remembering that the number is a clue, not a final judgment.
Why the same number can mean different things
A value in the middle range can fit a leak that is moderate. It can also look shorter when the ventricle is stiff and relaxation is abnormal, because pressure equalization happens differently. That is why clinicians compare the tracing with the rest of the echo, including vena contracta, regurgitant volume, and whether there is flow reversal in the descending aorta.
The older Doppler literature also showed that AR can shorten PHT and can distort other measurements, including mitral valve area estimates, which is one reason a single Doppler slope cannot carry the whole interpretation on its own classic study.
The same idea shows up in everyday patient questions too. Someone may read “moderate” and assume the valve has crossed a fixed line, while another person with a similar number may have a very different physiology behind it. That is also why a label such as mild leak can be discussed more carefully with a plain-language resource like this guide to mild valve regurgitation.
How to think about your own result
- Longer than 500 ms often suggests a smaller leak, but the rest of the study still matters.
- Between 200 and 500 ms sits in the gray zone where other findings matter a great deal.
- Shorter than 200 ms raises concern, yet it still needs the clinical context and left ventricular assessment.
If you are comparing reports, ask whether the blood pressure was similar, whether the left ventricle looked enlarged, and whether the Doppler tracing was technically clean. A person taking a medicine such as Xanax may also have questions about Xanax anxiety drug blood pressure concerns, because blood pressure is one of the physiologic factors that can change how the tracing behaves.


Why Pressure Half Time Can Mislead You
A pressure half time value can look tidy on paper and still point in the wrong direction if you read it as a stand-alone verdict. The number comes from how quickly the Doppler curve falls, and that fall is shaped not only by the leak itself, but also by systemic vascular resistance, left ventricular compliance, and left ventricular relaxation. In other words, the same valve can produce a different-looking trace when the rest of the circulation changes foundational study.
That is why pressure half time behaves more like a physiology story than a fixed ruler. A classic experiment showed that when the regurgitant orifice area changed, PHT moved in step with AR severity, but when the orifice area stayed constant, PHT could move in the opposite direction. The same study also showed that nitroprusside reduced regurgitant fraction by 0.009 while PHT tended to shorten, and dopamine increased regurgitant fraction by 0.01 with lengthening of PHT foundational study. Those small fractional changes matter because they show how loading conditions can shift PHT independently of valve anatomy, so a shorter or longer number does not always mean the leak itself has changed in a simple way.
The big confounders
High blood pressure can flatten or alter the slope because the ventricle is ejecting against a different load. A stiff ventricle can also distort the reading, because pressure equalization behaves differently when relaxation is abnormal. Tachycardia shortens the diastolic window, so the measurement has less time to settle and the tracing can look different for reasons that are not purely about the valve.
Bottom line: pressure half time is a clue, not a verdict.
A short value does not automatically mean the valve is the only problem. In some patients, the number is really reflecting broader diastolic dysfunction, which is why later outcome studies found that very short or very long values were not independently tied to mortality once diastolic variables were considered retrospective cohort.
If you are worried about medication effects on blood pressure and want a plain explanation of why that matters, Xanax anxiety drug blood pressure concerns is a helpful general read.
Three Stories From the Echo Lab
A young runner comes in with a soft murmur and a pressure half time near 600 ms. The rest of the echo fits a small leak, and the slow slope matches the picture. In that setting, the number behaves the way people expect it to behave.
An older patient arrives with high blood pressure and a pressure half time around 280 ms. At first glance, that sounds more concerning, but once the blood pressure is brought under control and the rest of the Doppler findings are reviewed, the leak turns out to be more modest than the raw number suggested.
The stiff ventricle case
A third patient has long-standing hypertension and a thick, noncompliant left ventricle. The pressure half time is about 180 ms, which looks worrisome if you read it alone. Yet the regurgitant burden is not as extreme as that number might imply, because the ventricle's relaxation abnormality is part of the picture.
These three cases look similar only if you focus on the number and ignore the heart around it. That's the mistake many people make after reading a report online. Clinicians avoid that trap by asking what the ventricle looks like, what the blood pressure was, and whether the Doppler tracing matches the rest of the study.
The key lesson is straightforward: The same pressure half time can mean different things in different hearts, and that's not indecision, it's physiology.
What to Do With Your Pressure Half Time Result
Bring the report to your clinician and ask what else supported the interpretation. Ask about vena contracta, regurgitant volume, flow reversal, and the left ventricle's size and relaxation pattern. Those details matter because they show whether the number is fitting the rest of the story or fighting against it.
If your blood pressure was high on the day of the scan, mention that too. A different loading condition can change the reading, and your clinician may want to compare the value with another study or with other signs from the same exam.
When follow-up matters more quickly
- New shortness of breath should be taken seriously.
- Chest discomfort deserves prompt attention.
- A clear drop in exercise tolerance should not be brushed off.
Even very short or very long pressure half times can reflect broader diastolic issues rather than valve severity alone.
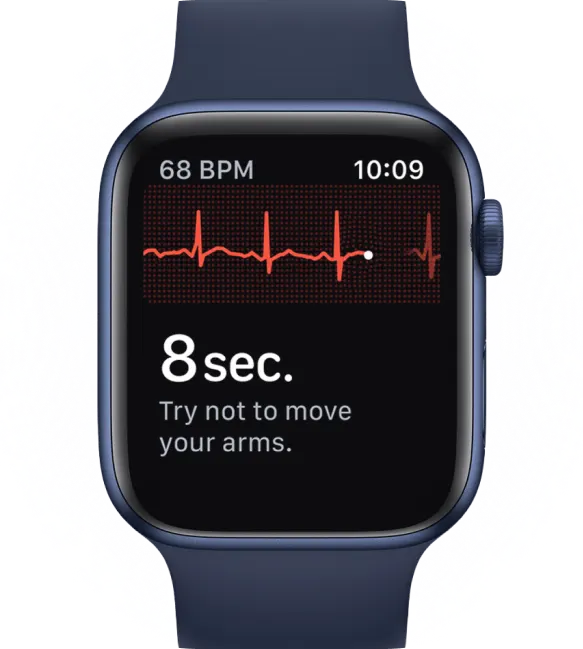
A smartwatch can still be useful for rhythm awareness and symptom tracking, but it can't measure pressure half time. So if you're monitoring at home, use the wearable for pulse trends and symptom timing, then let the echo data do the valve-specific work.
If you're still uneasy after reading your report, schedule a conversation with your cardiology team and bring the exact echo wording with you. If you use Qaly for wearable ECG review, keep using it for rhythm questions, but leave pressure half time interpretation to the echo report and the clinician who read it.

Unsure about an ECG? Certified experts review it within minutes.



.png)
.png)